Activity diagrams, depict the activities and responsibilities of elements that make up a system.
Activity modeling is a specialized type of behavioral modeling concerned with modeling the activities and responsibilities of elements.
Activity diagram is basically a flow chart to represent the flow from one activity to another activity. The activity can be described as an operation of the system.
control flow is drawn from one operation to another. This flow can be sequential, branched or concurrent.
The purposes of activity diagram is:
- Draw the activity flow of a system.
- Describe the sequence from one activity to another.
- Describe the parallel, branched and concurrent flow of the system.
Elements of an Activity diagram
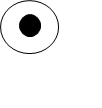
- Initial activity: This shows the starting point or first activity of the flow. Denoted by a solid circle, this is similar to the notation used for initial state.

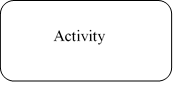
2. Activity: represented by a rectangle with rounded (almost oval) edges.
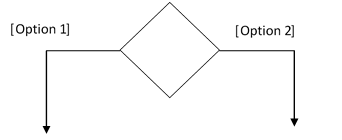
3. Decisions: Similar to flowcharts, a logic where a decision is to be made is depicted by a diamond, with options written on either sides of the arrows emerging from the diamond. Within the box brackets.
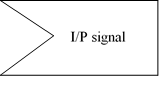
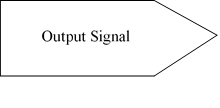
4. Signal: When an activity sends or receives a message, that activity is called a signal. signals are of two types: input signal (Message receiving activity), shown by a concave polygon and output signal (Message sending activity), shown by a convex polygon.
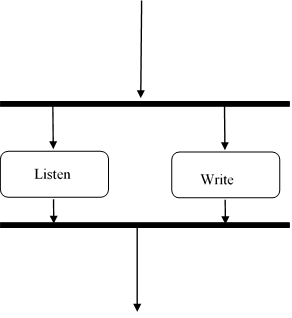
5. Concurrent Activity: some activities occur simultaneously or in parallel. Such activities are called concurrent activity. This is represented by a horizontal split (thick dark line) and the two concurrent activities next to each other and the horizontal line again to show the end of the parallel activity.
6. Final Activity: the end of the activity diagram is shown by a bull’s eye symbol also called as a final activity